Bounce rate, the percentage of visitors that leave your website from the landing page without any other pageviews, is an important metric to measure engagement and conversion success. In this comprehensive guide, we explain what bounce rate is, provide tips for analysis to identify issues, and strategies to reduce bounces and improve visitor retention.
There are a lot of aspects to ponder once one decides to refine their SEO endeavours. Quality content, engaging metadata, well-crafted Call-to-Actions and many other things to consider. And if that wasn’t enough to please almighty Google, it had to go and throw in its definition of what bounce rate is, adding to many online marketeer’s worries about whether or not their site rankings hinged on Google’s confusing mandate. Nobody can fault you for being slightly perplexed about Google Analytics Bounce Rate.
The bounce rate definition might seem simple enough to the more meticulous reader, but it can be a bit confusing to most of us. Bounce rate is single-page sessions divided by all sessions or the percentage of all sessions on your site in which users viewed only a single page and triggered only a single request to the Analytics server.
That was fancy robot talk that translates to, “People come to your site, hit a page, then get out of dodge.” Google Analytics calculates its version of the bounce rate by dividing the number of single visits to a page during a specific period over the total number of visits to the same page in the same period.
One can deduce that having a high bounce rate is bad for business while having a moderate to low bounce rate is fine and dandy, but it’s not clear-cut.
So, to shed some light on the issue, we will put most of the facets relevant to bounce rates at large in perspective and figure out how much Google Analytics Bounce Rate matters regarding SEO.
Table of Contents
What Is Bounce Rate?
Unfortunately, they have nothing to do with bouncy castles. But bounces and bounce rates are noteworthy aspects that may govern your blog or website’s search engine results page ranking.
Let’s assume that you’re looking for information about knitting clothes for badgers (no judgment here), and after a zippy Google search, you gaze upon the first page of your enquiry’s SERPs. Naturally, you go for the closest link to your search enquiry, assuming it has what you need.
You waltz in, finally ready to knit that cosy sweater for your badger friend, when you find that the page is poorly planned, has unappealing and frankly dull content, and is full of ads and clickbait.
Disappointed with your brief but harrowing experience, you decide to leave the page in a few seconds, never to return.

Google Analytics calculates the bounce rate as the percentage of single-page sessions on your site. For example, if 100 users visited your homepage but only 50 browsed past it, your bounce rate would be 50%. A high rate generally indicates a poor user experience.
Step-by-Step Guide to Viewing Bounce Rates:
Step 1: Log into your Google Analytics account and navigate to the site or property you want to analyze.
Step 2: Open the Behavior section, then click on Site Content in the left menu.
Step 3: Here, you will see a graph of your pages ordered by Bounce Rate percentage. Review this to get an overview of the highest/lowest bounce rates.
Step 4: To see more details, click on the “Landing Pages” report under Site Content.
Step 5: This report shows bounce rate data for each landing page. Click on a specific page to dive deeper.
Step 6: Analyze the metrics in the page details:
- The bounce rate shows the percentage of exits from this page.
- Exit percentage provides the exits as a percentage of all page views.
- Time on the page indicates the average time visitors spend on the page.
Step 7: Switch to the “Site Content” report and filter by “Landing Page” to only see bounce rates for landing pages specifically.
Step 8: Export these reports to Excel or Google Sheets for additional analysis on bounce rate patterns or trends.
Step 9: For mobile, go to Mobile App reports and analyze Bounce Rate under User Flow report.
Following these steps will provide you with the detailed bounce rate data you need to uncover opportunities to improve engagement on landing pages and site content.
Typical Bounce Rate Benchmarks:
- Ecommerce: 40-55%
- Lead Generation: 30-45%
- Informational Sites: 50-70%
Analyzing Bounces to Identify Causes:
- Review page content – is the value proposition and USP clear?
- Check page load speed – is it taking too long?
- Look at exit links – are visitors clicking out to other sites?
- Assess design and calls to action – do they encourage exploration?
Strategies to Reduce Bounces:
Improve headlines and intro copy – Headlines should convey the core benefit of the content. Intros should grab attention and highlight value.
Enhance calls-to-action – CTAs should stand out visually, clearly explain the next steps, and motivate users to click. Place them strategically.
Increase page speed – Improving page load time keeps visitors engaged. Optimize images, minify code, compress files, and cache pages.
Refine layout and navigation – Remove unnecessary links or clutter to simplify navigation. Ensure key pages are easy to find.
Personalize content with geotargeting – Recognizing visitor location allows for delivering customized content and offers.
Leverage exit-intent popups – Display targeted offers or exit surveys to users about to leave.
Use click-triggering exit surveys – Ask why users are leaving with non-intrusive surveys.
Test introductions and headlines – Try different intro copy and headlines with A/B testing to optimize.
Add more internal links in content – Linking to related content encourages further exploration.
Include reading time estimates – Indicating more in-depth content helps set expectations.
Add related content modules – Suggesting more relevant content helps engagement.
Implement chatbots – Interactive chatbots can answer questions and reduce exits.
How Does Google Determine What Is a Bounce?
You go back and resume the hunt for cosy badger fashion tips. You click on another site that seems promising and hope for the best. Turns out, this singular page you went to has all the information you need on how to keep Benson the badger warm and snug throughout winter, and it even goes into detail on all the aspects you were worried about.
So, you spend upwards of twenty minutes learning as much as you can. You leave the page when you feel satisfied and full of woollen knowledge.
See the problem? Google Analytics Bounce Rate supposedly disregards things like user satisfaction and content quality. It’s a possibly useful metric to gauge your online marketing efforts, focusing more on whether or not people visited other pages on your website.
The more page views Google perceives, the better (lower) your bounce rate. The faster and more often they leave without poking and prodding, the worse (higher) your bounce rate will be. One can deduce from the humble example above that this isn’t exactly fair.
Standard bounce rating algorithms consider a page hit without interaction or engagement as an effective bounce, disregarding time spent and user satisfaction.
Search engines, however, don’t just dismiss the time you took reading the article and scrolling up and down. Many terms, calculations and conditions govern how Google Analytics ranks your sites. Sticking to just Google Analytics Bounce Rate as a metric isn’t recommended.
Why Does Your Bounce Rate Matter?
Google has repeatedly stated that Google Analytics Bounce Rate measurements have no real impact on your site ranking. High bounce rates don’t always accurately indicate how badly your pages are performing.
Usually, when anyone does anything, they do it with a specific purpose in mind. If you’ve ever looked at Google Analytics and its bounce rate for your sites, you’ll notice that many pages you’ve planned out from the get-go are informative rather than generating views and conversions to have a high bounce rate. Now, does that mean you’re doing something wrong?
Not really.
You designed those pages to convey a message your visitor was looking for. They find it, dwell on it, and then pop out, meaning you’ve benefited someone in need. And who knows? Maybe they’ll come back for more, explore your site or link back to it on their blogs and social media accounts. Google Analytics Bounce Rate, without the proper configuration and understanding required to benefit from it, automatically assumes somebody leaving within 30 minutes of them visiting a page to be a bounce.
But it doesn’t factor in dwell time or events such as scroll tracking, which would have factored into the previous example and lowered the high bounce rate. Remember that bounce rates are almost entirely based on what you want them to portray. Do you want them to be a representation of page visits? Dwell time? Content quality? It’s all for the sake of your analysis.
It’s also wise to remember that Google Analytics can easily be manipulated to fudge the bounce rate. Rates as low as 10% or even 5% have been seen numerous times, either due to bad installation or malicious intent. Rates as low as these are a cause for alarm and scrutiny.

Google Analytics Bounce Rate and SEO
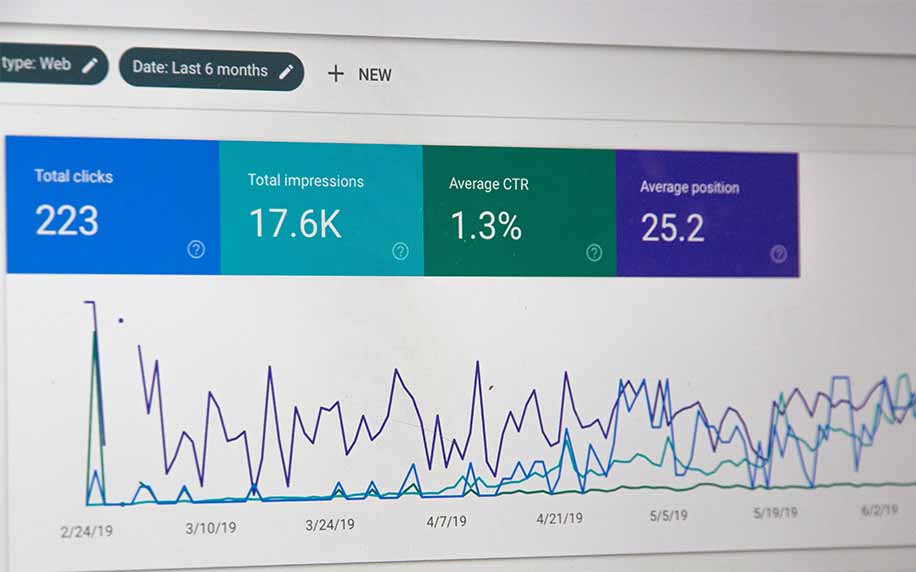
Businesses are using Google Analytics Bounce Rate to get feedback about their website. Credit: Myriam Jessier
It’s safe to say that we’ve effectively covered the cliff notes about both search engine optimisation and proper online marketing tips in the past. The key to a strong online market presence and proper SEO is quality content, first and foremost.
You want your blogs and websites to be home to attractive insights and engaging events that do almost everything for you. And even though Google doesn’t use Google Analytics exclusively to determine your site rankings, it’s still a worthwhile idea to use Google Analytics Bounce Rate as more of a gauge of how well your site performance and potential conversion rates can improve:
Before and After
Google Analytics Bounce Rate can be a great tool to determine how well your sites are doing over time. You might think that an aspect of your landing page is poor and want to change it to something different. Maybe add some Calls-to-Action like newsletter subscriptions or more links to relevant pages or partners.
Maybe that one ad you’ve had for a while is bothering people and making them buzz off far faster than you’ve anticipated. Or perhaps you want to optimise your pages with a continuous sidebar to further your site’s usability and appeal to would-be-leads. How would you know if any of these changes had any real impact?
Bounce rate is indeed a fundamentally flawed concept if perceived as a gauge of how well your site is doing overall. But it’s a nifty indicator of how often people visit, stay on and explore your sites between different iterations. Provided you’ve tinkered with it enough to include proper page hit detection and event logging.
On-page fixes for High Bounce Rates
Now, you want to know how well your informative content holds up against others. You want to see how you can optimise it as much as possible. This is where an adequately configured Google Analytics can come into play.
By investing in advanced scroll tracking and paying closer attention to dwell time, which is the actual period that visitors spend on a page before jumping back to the SERPs, you can figure out whether or not your potential patrons enjoyed the content you worked so hard on sharing with the masses.
Considering the time they spent reading it, the time they took before disappearing and the number of scrolls up and down the page. In this scenario, these events positively impact your site’s popularity and bounce rate.
Similarly, Suppose your site is more geared towards direct engagement via engagement hits, such as subscriptions or item checkouts (e-commerce). In that case, Google Analytics Bounce Rate can be a good indicator of how well your site’s layout is doing.
In this scenario, you’re looking for a typically lower bounce rate, signifying more interaction with the site’s features and less premature evacuation. It all depends on whether or not you have your Google Analytics adequately configured.
Taking Insights from Your Bounce Rate
While the brick-and-mortar definition of Google Analytics Bounce Rate or any other bounce rate may sound disheartening to would-be online entrepreneurs only wishing to funnel more potential leads down their virtual funnels, it all comes down to how you can view it in a way that serves you and your SEO endeavours through insight rather than a simple choice between good or bad.
One would hope that after reading through this article, one can deduce that bounce rates aren’t a black-and-white indicator of how good your content or brand is or how well you rank on Google’s search engine results pages. Google Analytics Bounce Rate is more aimed at cross-examining your strategies in various ways.
Comparing current you to past you regarding page content, SEO and general ranking on a SERP. Though it does not directly impact your ranking, it does an excellent job of telling you how people react to your pages, how well your message is conveyed to them, and what you can do to generate more appeal towards your online presence.
There’s also the matter of bounce rate versus exit rate. Bounce rates generally apply to visitors leaving single pages, usually your landing page. In contrast, exit rates apply to visitors leaving after several pages.
What this means is if visitors were to read a multi-page article on your site and leave somewhere in the middle, that could mean your content isn’t engaging enough. But if they leave on the absolute last page, it could mean your content was interesting enough to follow through. Make of it what you want by how you want to lay down your strategy and SEO.
Other metrics worth your time and research are Click-Through rate and dwell time.
We briefly mentioned dwell time, but in case it wasn’t clear enough, it’s basically how long people stay on your pages before leaving. A high dwell time means your pages are engaging enough to garner somebody’s attention for over a few seconds. But what about CTR? It’s a metric most search engines, including Google, make good use of when ranking sites.
More clicks mean more traffic, but it can easily be manipulated with misleading titles and cheap, shady metadata. Now, if you pair those two metrics together, you’d have a much higher quality system of appraising your web content. Comparing CTR and dwell time on each site would give you an accurate representation of how good your content is compared to the standard Google Analytics Bounce Rate.

Google Analytics Bounce Rate: Wrapping Up
Afraid so. Though these few insights into how Google Analytics Bounce Rate and most other metrics and aspects of Google’s ranking are nifty, they are by no means the only references you need to get started on your quest to rank high and dry on Google‘s good side. Consider running around a bit and reading more into the matter all over the great, vast interwebs.
Time is money, after all.
Google Analytics Bounce Rate FAQs
Q: What is a good bounce rate?
A: There is no universal “good” bounce rate. It depends on industry, with ecommerce sites around 40-55% and informational around 50-70%. Focus on reducing your own site’s historical bounce rate.
Q: Does time on the page affect the bounce rate?
A: Yes, the more time spent on a page, the less likely to bounce. But a short time on the page doesn’t always mean a bounce if the user continues.
Q: How do I calculate the bounce rate?
A: Bounce rate = (Single page sessions / Total sessions) x 100. Use Google Analytics for accurate bounce rate data.
Q: Should I eliminate all bounces?
A: Not necessarily – some bounces are natural where the page fulfils the user’s need. But work to convert casual visitors into engaged users.
Q: Can the bounce rate be higher on mobile?
A: Yes, due to smaller screens and accidental clicks, mobile bounce rates tend to be slightly higher than desktop.
Google Analytics Bounce Rate Conclusion:
By understanding what constitutes a bounce and regularly analyzing bounce rate data, sites can identify weak points and opportunities to improve user engagement. Follow tips like crafting compelling content, simplifying navigation, and creating value on landing pages to reduce bounce rates and, in turn, boost conversions and visitor retention.
 ProfileTree


 Eman Sameh // 11th February 2024